Earth System Modeling
I study Earth and other planets, primarily through numerical modeling. Complex Earth system models provide a way to test our fundamental understanding of physical processes and explain observed phenomena. They also provide future predictions of the atmosphere and climate. Below, I outline some of my current and past projects. A list of published and submitted papers can be found on my CV. See my Github site for models I employ and temporal kernels that can be used in calculating radiative forcing.
Arctic carbon feedback
Twice as much carbon exists below ground in the arctic as in the atmosphere. This carbon is being released due to global warming, which could greatly accelerate the warming and release more carbon. This positive feedback cycle could potentially be balanced by increased vegetation growth due to CO2 fertilization and warmer temperatures. However, current models do not even agree on the direction of the Arctic carbon feedback (McGuire et al. 2018). This large uncertainty can be attributed to several mechanisms such as changes in the water table, CO2 fertilization, and shrub and tree expansion that are poorly resolved in current climate models. My current research reduces aspects of this uncertainty by adding these processes to models.
At Harvard, I developed an Arctic version of a terrestrial biosphere model (ED2-Arctic). ED2 is a mechanistic model that uses a statistical approach to scale individual plant processes to landscape levels. I am specifically interested in simulating the current and future carbon budget of the Arctic in relation to its global effects. Recent eddy covariance tower measurements have highlighted the importance of winter heterotrophic respiration in the annual carbon budget. I implemented a vertically resolved soil respiration module that when combined with the dynamic vegetation, allows our model to close the current carbon budget and predict the fate of the large stocks of thawing Arctic peat.
Calculating radiative forcing and Earth's energy budget
Radiative forcing is the change in radiative flux due to some forcing agent such as greenhouse gasses or aerosols. This change in radiation can be measured anywhere in the atmosphere, but is often defined at the top of the atmosphere. Direct measurements of radiative forcing are difficult to quantify due to the many feedback mechanisms that affect the radiative flux and act on different timescales. Dr. Portmann at NOAA and I have developed a new method of calculating radiative forcing in climate model simulations using a linear algebra kernel. The slides below explain how the kernel works. For more information, please see our publication in the Journal of Climate.
Radiative forcing is the change in radiative flux due to some forcing agent such as greenhouse gasses or aerosols. This change in radiation can be measured anywhere in the atmosphere, but is often defined at the top of the atmosphere. Direct measurements of radiative forcing are difficult to quantify due to the many feedback mechanisms that affect the radiative flux and act on different timescales. Dr. Portmann at NOAA and I have developed a new method of calculating radiative forcing in climate model simulations using a linear algebra kernel. The slides below explain how the kernel works. For more information, please see our publication in the Journal of Climate.
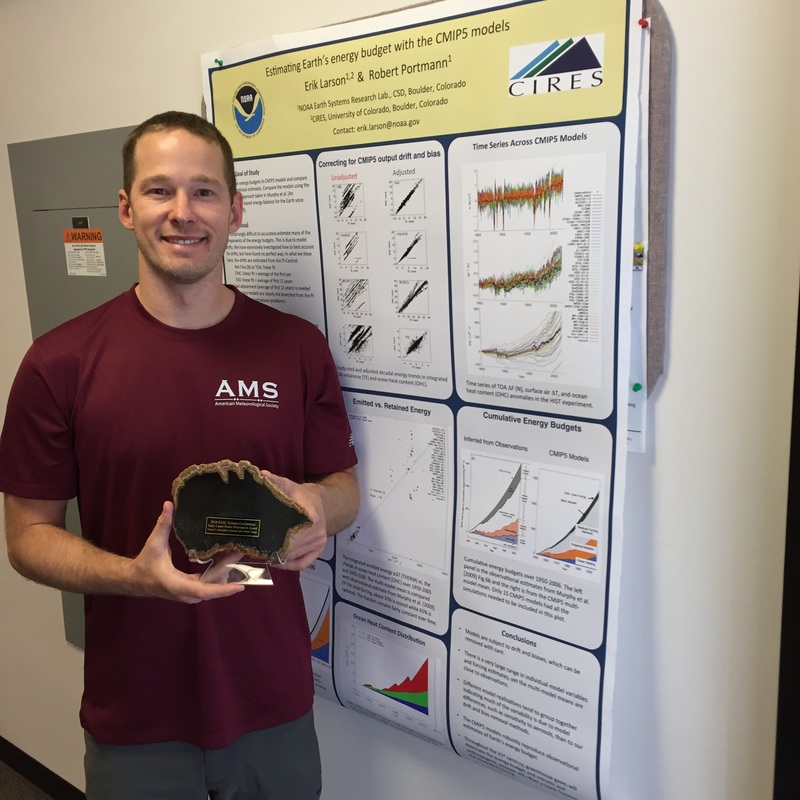
Accurate estimates of radiative forcing allow us to calculate Earth's global energy budget from climate model output. Dr. Portmann and I are currently estimating this budget using output from the 5th Climate Model Intercomparison Project (CMIP5). Using many models provides a range of values due to differences in vertical resolution, solving algorithms, inclusion of interactive chemistry or aerosols, and a host of other parameters. Below is a photo of me (Sep. 2016) after the International Global Atmospheric Chemistry conference with an early career award for my poster presentation of this work.
A related study provides the first "observationally based" estimate of historical radiative forcing and the anthropogenic aerosol component. Our historical anthropogenic aerosol forcing is consistent with the IPCC AR5 estimates with slightly lower uncertainty ranges. The paper was published in GRL.
A related study provides the first "observationally based" estimate of historical radiative forcing and the anthropogenic aerosol component. Our historical anthropogenic aerosol forcing is consistent with the IPCC AR5 estimates with slightly lower uncertainty ranges. The paper was published in GRL.
I recently calculated the GHG emissions that would be consistent with achieving the Paris Agreement Temperature goal of 2C warming above preindustrial values. This work was recently published in Scientific Reports. The allowed GHGs are sensitive to the aerosol emissions over the next century. High aerosol emissions offset a portion of the GHG radiative forcing, however, under all scenarios GHG emissions need to drastically reduce by mid century to stabilize warming to 2 degrees.
Modeling the physical properties of Titan's organic haze
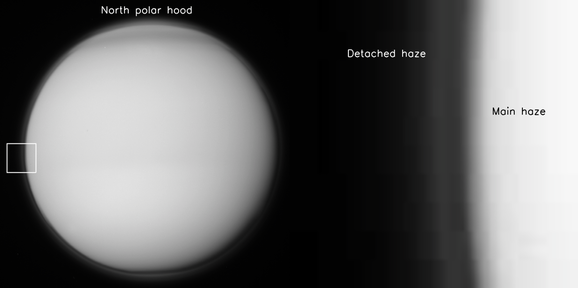
Titan, the largest moon of Saturn, has a thick organic haze layer that enshrouds the planet making it impossible to see the surface at visible wavelengths. There is also a detached global haze layer above the main haze. In collaboration with scientists at JPL and the University of Colorado, I developed a global circulation model with a coupled aerosol microphysical model that simulates Titan's thick aerosol haze. We used this model to determine the size and shape of the haze particles as well as describe the seasonal cycle of the detached haze layer. This layer forms very high in the atmosphere and drops over a hundred kilometers abruptly after Titan's equinox before disappearing during the northern summer season. Below is an annotated image of Titan from the Cassini spacecraft showing the thick haze. The inset on the left of Titan's limb is shown on the right. The detached haze is clearly visible above the main haze layer.
Check out the article I wrote for Scientific American.
Modeling the physical properties of Titan's organic haze
Titan, the largest moon of Saturn, has a thick organic haze layer that enshrouds the planet making it impossible to see the surface at visible wavelengths. There is also a detached global haze layer above the main haze. In collaboration with scientists at JPL and the University of Colorado, I developed a global circulation model with a coupled aerosol microphysical model that simulates Titan's thick aerosol haze. We used this model to determine the size and shape of the haze particles as well as describe the seasonal cycle of the detached haze layer. This layer forms very high in the atmosphere and drops over a hundred kilometers abruptly after Titan's equinox before disappearing during the northern summer season. Below is an annotated image of Titan from the Cassini spacecraft showing the thick haze. The inset on the left of Titan's limb is shown on the right. The detached haze is clearly visible above the main haze layer.
Check out the article I wrote for Scientific American.
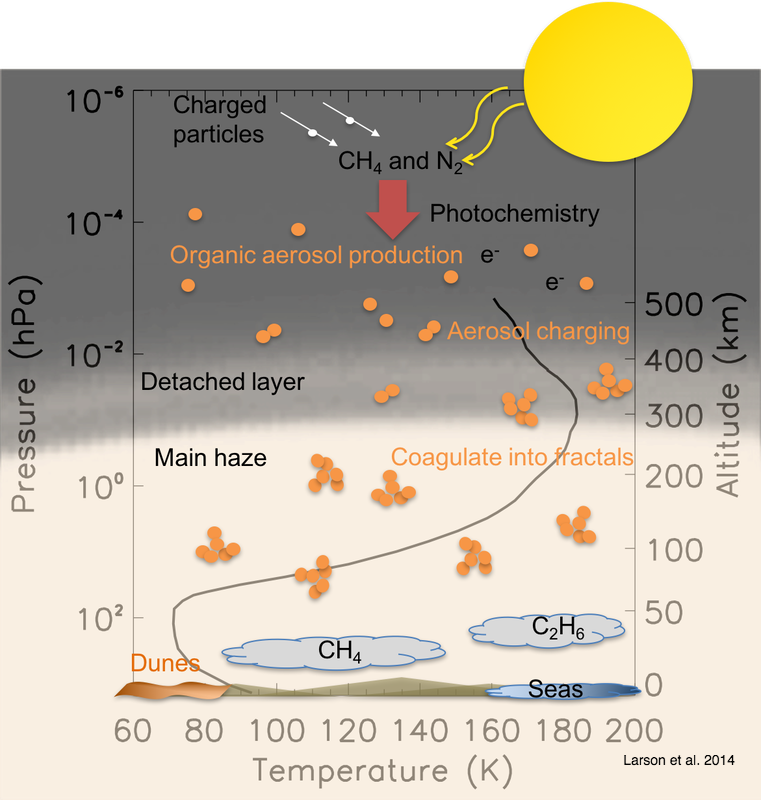
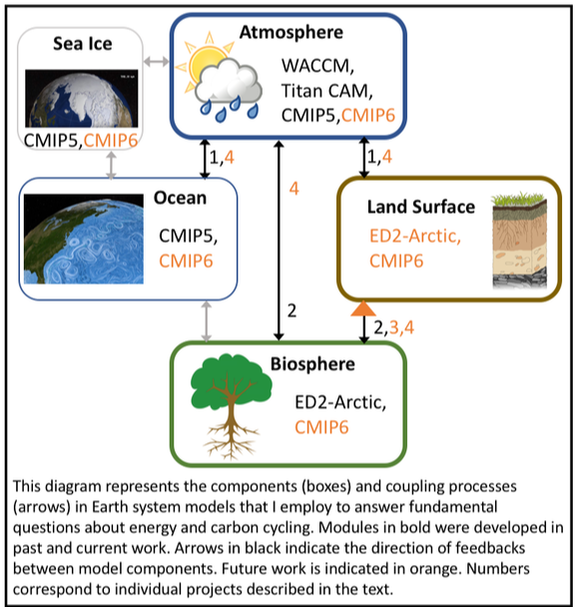
Physical processes controlling the formation and fate of the haze are displayed in the cartoon above. These processes were incorporated into the model. The animation below indicates the number density of haze particles in Titan's atmosphere over the course of one Titan year. The detached haze layer is evident around 300 km in this simulation.
Climate and ozone impacts due to rocket emissions
Individual rockets plumes have been observed to create polar mesospheric clouds and the aggregate effects of rocket launches are suggested to cause observed secular changes in upper atmospheric clouds and gas concentrations. Collaborators at NOAA and the Aerospace Corporation and I are using the Whole Atmosphere Community Climate Model (WACCM) to investigate the impacts of both current and future rocket launch rates on the climate and ozone. We have started the investigation with a new and relatively clean rocket that burns hydrogen and liquid oxygen. We find that at very high launch rates, even these clean burning rockets have the potential to destroy detectable amounts of stratospheric ozone and enhance upper atmospheric clouds. We are continuing this investigation with other types of rocket fuels.
Aerosols over the Himalayas
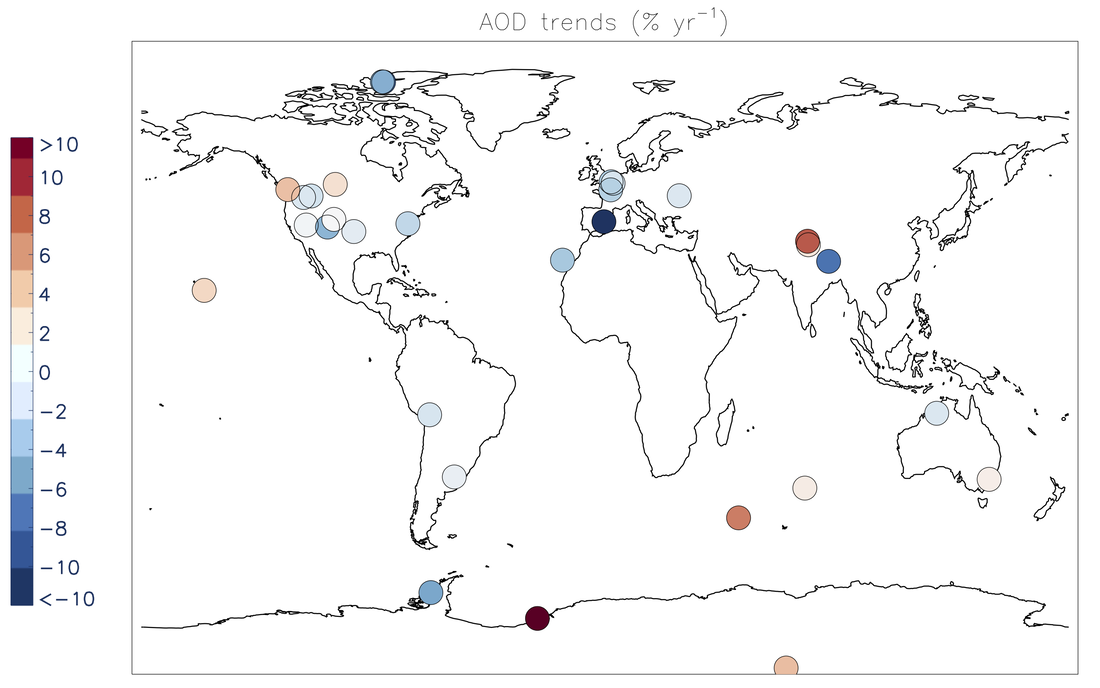
A sky radiometer was installed in the Himalayas in Northern India to investigate the daytime seeing as part of a solar observatory site selection study. The study is led by researchers at the Indian Institute of Astrophysics in Bangalore, India. I started collaborating with this group in 2008 as a NSF funded summer student in the IRES program. We analyzed data from this instrument to characterize the aerosol loading over the region and compared it with satellite estimates. We also compare the aerosols and other meteorological data to other prominent solar observatories. We find that high altitude sites in Northern India are excellent locations for day and night time observing and have seeing characteristics comparable to other prominent observatories. This collaboration has continued over the years and turned into a fruitful working relationship. The figure below shows the trend in the background aerosol optical depth (500 nm) over 30 remote Aeronet sites.
A sky radiometer was installed in the Himalayas in Northern India to investigate the daytime seeing as part of a solar observatory site selection study. The study is led by researchers at the Indian Institute of Astrophysics in Bangalore, India. I started collaborating with this group in 2008 as a NSF funded summer student in the IRES program. We analyzed data from this instrument to characterize the aerosol loading over the region and compared it with satellite estimates. We also compare the aerosols and other meteorological data to other prominent solar observatories. We find that high altitude sites in Northern India are excellent locations for day and night time observing and have seeing characteristics comparable to other prominent observatories. This collaboration has continued over the years and turned into a fruitful working relationship. The figure below shows the trend in the background aerosol optical depth (500 nm) over 30 remote Aeronet sites.